MSC12xx Programming Using Open-Source Tools
|
Charles Repetti Russell Anderson |
Sandpiper Associates, Inc. |
ABSTRACT
This Application Report shows the steps required for
compiling and debugging a program targeted for the MSC12xx microcontroller
using SDCC, an open-source compiler for
the 8051, and SDCC-SDB, an open-source debugger for SDCC. Windows, Macintosh and Linux host platforms
are all supported with this approach.
Contents
Windows Step 2: Install
NMake from Microsoft
Windows Step 3: Install
Active PERL from ActiveState
Windows
Step 3a: Install Win32::API using PPM...
Windows
Step 3b: Install Win32::SerialPort from CPAN
Windows Step 4: Install
SDCC-SDB from the SourceForge
Macintosh Step 1: Install
the Terminal Utility
Macintosh Step 2: Install
the XCode Tool
Macintosh Step 3: Install
the Appropriate Version of GCC
Macintosh,
Linux, and Cygwin Platforms
Mac/Linux Step 1: Install
the Sdcc Compiler
Mac/Linux Step 2: Install
the PERL Device::SerialPort module
Mac/Linux Step 3: Download
SDCC-SDB
Mac/Linux Step 4:
Determine the Device Name and Permissions
Debugging Step 1: Setting
up the Serial Port
Debugging Step 2: Building
a Debug Target
Debugging Step 3:
Downloading a Program
Stepping Through An
MSC12XX Program
Printing Variables and
Setting Breakpoints
Executing
Debugger Commands at Startup
Introduction
Sometimes C programs simply do not behave as expected. While a careful rereading of the code in question can sometimes reveal a solution, it is often more helpful to trace the execution of the program as it runs. This can be done with the “Small Device C Compiler”, or SDCC, and SDCC-SDB, a symbolic debugger for SDCC and the MSC12xx family of microcontrollers. Variables may be examined to be sure of their values. All 8051 CPU registers, including those associated with the special capabilities of the MSC12xx, may be inspected to be sure of how the microcontroller’s peripherals are configured and operating.
This Application Note describes how to install and run the open-source SDCC-SDB debugger. The SDCC-SDB debugger uses a monitor program, which is a small code file linked to one’s MSC12xx program before downloading to the debug target hardware.
There are two separate monitors available for use with the MSC12xx series microcontrollers. The first is a lightweight version, which requires only a few hundred bytes of additional flash memory to work with an existing program. For the advanced user, there is a real-time monitor, which requires about four kilobytes of additional flash memory to run. The real-time monitor runs at the precise speed of the processor, with any number of breakpoints set. This is helpful for debugging timing-critical sections of code.
All source code for
both monitors and the host debugger is included. The source code for the SDCC compiler and all
of its libraries is included with SDCC.
Microsoft Windows, Cygwin, the Macintosh, and Linux platforms are all
supported.
A special section for the Windows Platform immediately follows. Then, special instructions for the Macintosh platform are presented. Next, a section on steps common to both the Macintosh and Linux platforms is provided. Instructions for using the debugger, which are the same for all supported platforms, conclude this Application Note.
Windows Platform
The Windows installation requires a number of steps, which
may be summarized as:
1)
Install SDCC
2)
Install nMake
3)
Install ActivePerl
a.
Install Win32::API using PPM
b.
Install Win32::SerialPort using CPAN
Install SDCC-SDB
Windows Step 1: Install SDCC
SDCC is available from http://www.sourceforge.net/projects/sdcc. A convenient Microsoft Windows package with an installer is available. This single file named sdcc-x.x.x-setup.exe (where “x.x.x” is the version number, such as “2.5.0”) may be downloaded and run to produce a complete working compiler. Once this is complete, it is a good idea to test the results by opening a DOS window, and typing sdcc –v on the command line. This will print the version number, which must be version 2.5 or better. The results should look something like the following:

Windows Step 2: Install NMake from Microsoft
Some version of make is required to in order to install new packages for ActivePerl. Microsoft’s version of “make” is named “nmake.” It is shipped with Visual C, but is also available for free from the Microsoft download page http://support.microsoft.com/default.aspx?scid=kb;en-us;Q132084.
Windows Step 3: Install Active PERL from ActiveState
A PERL interpreter is needed to run the portion of the debugger which resides on the host PC. Simple instructions for downloading and installing it are available from http://www.ActiveState.com. Once completed, this installation may be tested by typing “perl -v” on a DOS command line. The results should look something like this:

Windows Step 3a: Install Win32::API using PPM
Two items must be added to complete a new PERL
installation for use with SDCC-SDB.
First, the Win32::API library must be added. The PERL Package Manger is used for this
task, since this tool is capable of installing the Win32::API package without
depending upon a C compiler.
Typing ppm install Win32-API at a command prompt will download this item from your internet connection and install it. The results look like the following:

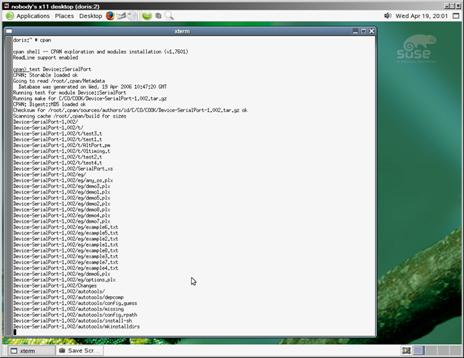
Windows Step 3b: Install Win32::SerialPort from CPAN
The Win32::SerialPort package must now be installed. The Perl Package Manger does not support the
Win32::SerialPort package, so one must use a tool from “The Comprehensive PERL
Archive Network”, or CPAN, instead.
Type the cpan Win32::SerialPort
command at a DOS prompt to download the new package using your internet
connection. A careful read of the
on-screen transcript reveals that CPAN did download the package, and informs us
that no make file will be created. CPAN always
attempts to make any targets in the build directory, but none were actually
created. So, the errors reported can
safely be ignored.
Now, as the on-screen transcript suggests, change to the newly
created directory by typing cd
\Perl\cpan\build\SerialPort-x.xx. Finally,
run install.pl to complete
installation of the Win32::SerialPort package. An illustration of these procedures follows:
 .
.
Windows Step 4: Install SDCC-SDB from the SourceForge
Finally, the debugger must be installed. A windows installer is available for this
final item, as well. The SDCC-SDB debugger
is located at http://www.sourceforge.net/projects/sdcc-sdb.
First download sdcc-sdb.exe to a temporary folder and run it. This will expand a group of files to a temporary directory. Finally, run setup.exe from this new directory. After a welcome screen, and a screen for the license agreement, a screen for the installation directory appears. It is strongly recommended that the default installation directory be accepted, as all of the samples are set up to work from the default location.

Once complete, it is again a good idea to test the installation before proceeding. This can be done by typing sdb at a command prompt, and then pressing the ENTER key. Once the program has started, press ENTER again at the prompt, and the screen should look something like the following:

Enter q to leave the debugger and continue to the section of this document named “The Lightweight Debugger” to see how to debug an example program.
Macintosh Platform
In order to prepare the Macintosh for use with SDCC-SDB,
three steps must be completed. These
are:
1)
Install the Terminal Utility
2)
Install the XCode development system
3)
Install the proper version of gcc, the GNU C
Compiler
Once these three steps are completed, the steps detailed for Linux/Macintosh must also be completed. The following sections contain more detailed information about completing these steps.
Macintosh Step 1: Install the Terminal Utility
OS X is based on the FreeBSD operating system. PERL is installed by default under Apple’s OS x, but a few components must be added to run SDCC and SDB. First off, the “Terminal” utility must be started. The menu item corresponding to “Terminal” appears under the “Applications:Utilities” menu item.

If a menu item appears in a washed-out grey color, that item has not been installed. If necessary, “Terminal” can be installed either from the CD which was shipped with your Macintosh, or from the Apple web site.
Macintosh Step 2: Install the XCode Tool
The XCode developers’ system must also be installed. It contains the gcc compiler, which will be used both to add the serial port routines to PERL and to build the SDCC compiler.
It too is available from either Apple’s CD’s or from Apple’s web site. XCode is anywhere from five hundred megabytes to one gigabyte in size, depending on the version of OS X involved. This may require hours to download and install over a broadband connection, so some extra time may be necessary for this task.
Macintosh Step 3: Install the Appropriate Version of GCC
XCode contains a number of versions of the gcc compiler. Typing gcc –v will report on the default version for your installation. Note that version 3.3 of gcc can not be used for building the Device::SerialPort package used by SDCC-SDB.
If 3.3 is the default gcc compiler, this must be changed with a sudo /usr/sbin/gcc_select 3.1 command. Other sets of gcc versions may be available; the actual choices vary between different OS X versions. Versions 3.1 and 4.0 of gcc have been successfully tested. Once SDCC-SDB is installed, the default gcc compiler should be reset to the version that first appeared with this version-checking command.
Once these steps are complete, installation for the Macintosh proceeds in the same manner as prescribed for Linux. This is detailed in the next section.
Macintosh, Linux, and Cygwin Platforms
All Unix platforms require the following set of steps in
order to prepare SDCC-SDDB. These
instructions are a continuation of the requirements for a Macintosh
installation, and are undertaken after the three steps in the above
Macintosh-only section above are completed.
For other Unix systems, such as Linux and Cygwin, these are the only
required steps.
1)
Install SDCC
2)
Install the Perl Device::SerialPort module
3)
Install SDCC-SDB
4)
Determine the Serial Device Name and Permissions
Mac/Linux Step 1: Install the SDCC Compiler
Complete details concerning the installation from source of SDCC are available from the SDCC home page, located at http://www.sourceforge.net/projects/sdcc. Version 2.5 or better of SDCC is required.
Mac/Linux Step 2: Install the PERL Device::SerialPort module
PERL is installed by default for nearly all modern Unix variants. This section interleaves examples from three different operating systems, but the results on each of the three for any of the example commands are equivalent.
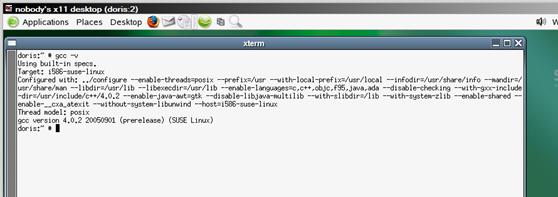
The PERL package Device::SerialPort must be added to most installations. Before that this is attempted, it is a good idea to be sure that gcc, the GNU C compiler, is installed. Typing gcc -v at a command prompt should look something like this, as seen under SUSE Linux:
Typing cpan at a shell prompt starts a PERL installation session. If cpan has never been run, a number of questions about the local operating system may be asked. The default answers are generally correct. An illustration of this under Cygwin is:

Once all the questions have been answered, and the cpan prompt appears, typing install Device::SerialPort will download, make, test and install the serial port interface for PERL. It is necessary to be connected to the internet for this step to succeed. This command will start as follows, as seen under SUSE Linux:
. 
When the command finishes, a report of success should appear, as seen on the Macintosh:

Next, installation will automatically proceed. This completes the steps required for PERL to use the serial port.
Mac/Linux Step 3: Download SDCC-SDB
The last step in a complete Unix setup is to download the
debugger from http://www.sourceforge.net/projects/sdcc-sdb
and install it into the user’s home directory.
Installation consists of downloading the file “sdcc‑sdb.tar.gz” to
the home directory of the user who will be using the debugger and unpacking it
with the tar xvzf sdcc-sdb.tar.gz
command.
Under Unix, the PATH
variable can be set to include the appropriate directory, so that the debugger
may be started by simply typing sdb.pl. The instructions for setting the PATH variable may vary amongst the
different shells, but often one may edit a file named “.bashrc” found in one’s
home directory, log out, and log back in again.
Mac/Linux Step 4: Determine the Device Name and Permissions
The first Linux serial port is named “/dev/ttys0”, but a
different name may be needed for a device connected to a USB serial port or a
serial port used with another operating system. One must know this device name to
proceed. If Cygwin is used, the device
name is “dev/ttySx”, where “x” is a number one less than the Windows “COMx”
device name. For example, “COM4” is
“dev/ttyS3” under Cygwin.
The user who is to develop software must be a member of the group for which ownership of the serial port is set. This group name can be identified by inspecting the file named for the serial device, which can be done with a command like ls –l /dev/ttys0. Although it is possible to change permissions on the device file directly, this is not the recommended procedure. Rather, the user who will be developing software should be assigned to the same group as already has ownership of the serial port. Needless to say, it is not a good idea to work as the “root” user.
Debugging – All Platforms
In order to debug a program on any platform, three steps
must be taken:
1)
Set up the
2)
Build a Debug Target
3) Download the Program to the Target Board
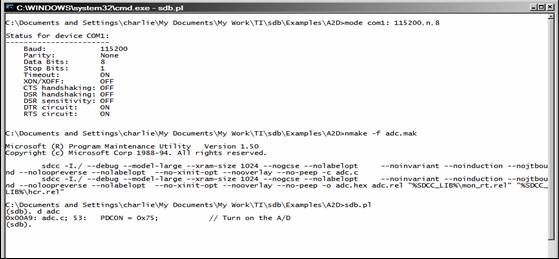
Debugging Step 1: Setting up the Serial Port
In order to debug a program, it is first necessary to set
the baud rate for the serial port. This
must be done whenever the serial port is first used. The settings will remain in effect until
they are changed by another process, or the computer is rebooted. Set the baud rate for the communications
port using a command like mode
com1:,9600,n,8 under Windows or stty ‑F/dev/ttyS0
9600 cs8 crtscts -parenb raw under Unix.
As discussed in the installation sections, the name of the serial port
varies depending on the system in use. Also,
some hosts work properly up to 115200 baud, while others may not exceed 9600
baud. Since most of the debug wait time
is accounted for by the programming of flash memory, the use of a higher baud
rate is not as helpful as one might hope.
Debugging Step 2: Building a Debug Target
In order to trace the logical flow of a typical C program, a debugging object must be
linked with the program to be traced. This file should be the last one included
on the SDCC command line. The “–Dsdb”
SDCC command line option must also be set.
The examples provided with SDCC-SDB include adc-win and
adc-unix, which are simple single-file programs for reading the
Analog-to-Digital converter. They are
located in the “sdcc-sdb/examples” directory. The make file shows a complete example of the
command line changes needed to debug a program with SDCC-SDB. In summary, these are the addition of the monitor
files to the linker line, and the use of the many SDCC debug options. The original program source does not need
any modification.
Executing the command
make –f adc.mak under Unix or nmake under Windows will prepare for
debugging by producing a set of output files.
Note that two different “.rel” files for adc.c are produced for use with
each of the two different debug monitors: “adc_rt.rel” is produced with the SDCC
“‑o” option, and “adc.rel” is produced from a different execution of the
compiler. Although at the compile stage
the content of these files is identical, the link stage will produce symbol
tables with different information. Using
different “.rel” object names is required to avoid any name collisions between
the two monitors at debug time.
Debugging Step 3: Downloading a Program
Type $HOME/sdcc-sdb/sdb.pl
-p/dev/ttyS0 to begin a debug session under Unix, or sdb –pCOM1: under Windows.
The actual name of the communications port specified with the –p option on each system may vary.
Once SDCC-SDB is running, typing the d adc command from SDCC-SDB command prompt will download and run
the lightweight debug version of the “adc” program. The first line of the program will be
displayed after the download is complete, and the debugger will then be ready
for additional commands. Also, if the
program has already been downloaded, the r
program command will run it from the beginning within the debugger without
a new download.
By running the d
adc_rt command from SDCC-SDB command prompt, one may change to real-time
debugging of the same program. However,
single-stepping through the program will be slower, as now flash memory pages
must be transmitted to and from the host computer as breakpoints and program
steps are encountered. Between these
stop points, though, the program executes in exactly the same number of clock
cycles as it would execute if the monitor and debugger were not present. Also,
four kilobytes of flash memory must be available for the real-time monitor to
be included in the download. If these
conditions are acceptable, however, the result is a much more faithful
reflection of the program’s normal execution.
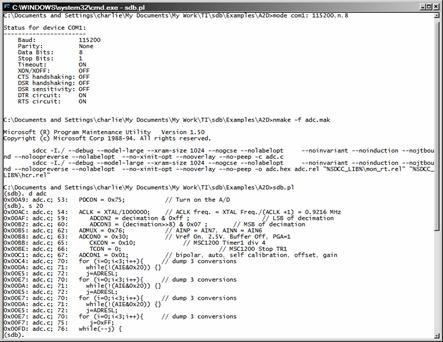
The following is the illustration of these three steps:
Notice that the first line of source code for the ADC program is shown after the download
command has completed. This shows that
the program has loaded, and is ready to execute beginning at the first line of
the source code. Texas Instruments
supplies a download program for Windows that can serve as a useful check on the
first two steps illustrated above. The Texas Instruments download program is
available from both the CD which ships with the MSC12xx evaluation boards, and
from the
In order to have an informative view of the program being executed, it is essential to open a copy of the source code in an editor window. An editor which reports line numbers is helpful. There are many choices of editors under both Windows and the Unix variants. Neither SDCC or SDCC-SDB include an editor in their installations. Notepad, Wordpad, and Visual Studio are common choices under Windows. Jstar, Emacs, and vi are typical Unix choices. Personal preference is a deciding factor in making a choice amongst the many available editors.
Stepping Through An MSC12XX Program
Executing the step command from within the debugger will trace the ADC program’s execution one line at a time. A number may be included with this command to step more than one line at a time, as follows:
By stepping twenty lines of code, we were able to see a part of the following adc.c program execute:
//
main(void) {
char i,j;
int decimation;
float result;
PDCON = 0x75; // Turn on the A/D
ACLK = XTAL/1000000; // ACLK freq. = XTAL Freq./(ACLK +1) = 0.9216 MHz
// 0.9216 Mhz/64 = 14,400 Hz
// Decimation Ratio, Data Rate = 14,400/1,440 = 10 Hz
decimation = 1440;
ADCON2 = decimation & 0xff ; // LSB of decimation
ADCON3 = (decimation>>8) & 0x07 ; // MSB of decimation
ADMUX = 0x76; // AINP = AIN7, AINN = AIN6
ADCON0 = 0x30; // Vref On, 2.5V, Buffer Off, PGA=1
CKCON = 0x10;
// MSC1200 Timer1 div 4
TCON = 0; // MSC1200 Stop TR1
ADCON1 = 0x01; // bipolar, auto, self calibration, offset, gain
//wait for the calibration to take place
for (i=0;i<3;i++){ // dump 3 conversions
while(!(AIE&0x20)) {}
j=ADRESL;
}
j=0xFF;
while(--j) {
while ( !(AIE & 0x20) ); // Waiting for conversion
result=bipolar(); // Save Results
result = result*LSB; // A good place to set a breakpoint
}
This example immediately exposes the motivation for the use of the real-time debug monitor rather than this lightweight monitor. With the lightweight monitor, after each assembly language instruction is executed, the address of the new current instruction is sent to the host for confirmation that execution should continue. Because of this communication overhead, the lightweight debugger executes at a small fraction of the processor’s actual clock speed. This means that the loop where we have ignored three analog conversions in order to create settling time for the converter was not realistically tested.
In fact, we allowed a relatively great deal of time to pass between conversions; at least a few hundred times as long as would have passed under normal operating conditions. So, even if we had only thrown a single conversion away, the debugger would have made the converter appear to have settled by virtue of its own slow execution speed. Then, as soon as we removed the debug support, a very different treatment of the same analog signal would have resulted.
Printing Variables and Setting Breakpoints
The commands pg and pl are available for printing all global and local variables. An example of pl command is illustrated here for the adc sample:
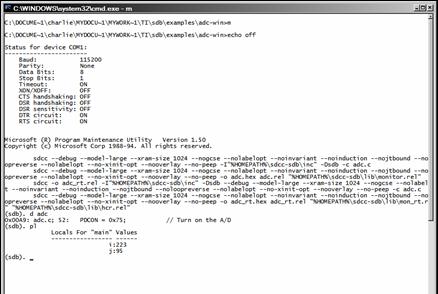
Since the program has just started executing in this example, the two local variables i and j contain initialized values. One might set a breakpoint at line 70 with the command bp 70, continue execution with the c command, and then see the assigned value of i appear with a p i command:
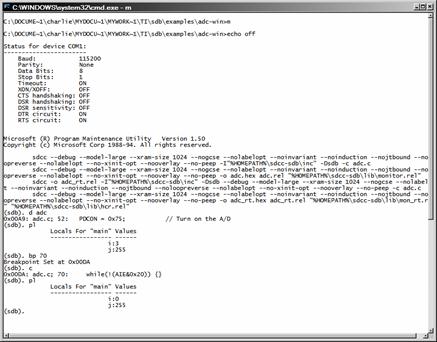
Special function register names are legal variable names,
and their values may be printed with the “p” command as well. Breakpoints may be set by line number or by function
name.
This is an example of the ADC makefile with the real-time monitor option:
CFLAGS = -Dsdb --debug --model-large –xram-loc 0x8400 --xram-size 1024 \
--nogcse --nolabelopt --noinvariant --noinduction --nojtbound \
--noloopreverse --nolabelopt --no-xinit-opt --nooverlay --no-peep
SDB_INC = $(HOME)/sdcc-sdb/inc
SDB_LIB = $(HOME)/sdcc-sdb/lib
adc.hex: adc.rel
sdcc $(CFLAGS) -o adc.hex adc.rel $(SDB_LIB)/mon_rt.rel \
$(SDB_LIB)/hcr.rel
$(HOME)/sdcc-sdb/sdb.pl
adc.rel: adc.c
sdcc $(CFLAGS) -I$(SDB_INC) -c adc.c
Note that two files are now included: “mon_rt.rel” and “hcr.rel”. The source code for these is included in the “sdcc-sdb/src” directory. The “hcr.asm” file contains a single register definition for the MSC12xx Hardware Control Register. This definition specifically allows flash memory code segments to be written to, and looks like this:
.area hcr (CODE,ABS)
; This is the definition for the "Hardware Control Register"
; which defines the memory partition between flash code and data
; It is written to when the program is loaded, and is read-only
; at program run-time.
;
.org 0x807E
.db 0b11111111
; ||||||||
; |||||||- Enable General Purpose I/O for Ports 2 and 3
; ||||||| 0 Port 2 is used for External Memory 1 Port 2
; ||||||| 1 Port 2 and 3 are used as General Purpose I/O (default)
; |||||||
; ||||||-- Enable General Purpose I/O for Port 0
; |||||| 0 Port 0 is used for External Memory
; |||||| 1 Port 0 is used for General Purpose I/O (default)
; ||||||
; |||||--- Disable Digital Power-Supply Brownout Reset
; ||||| 0 Enable
; ||||| 1 Disable (default)
; |||||
; ||||---- Disable Analog Power-Supply Brownout Reset
; |||| 0 Enable
; |||| 1 Disable (default)
; ||||
; ||------ Analog Supply Browout Level Select
; || 00 4.5V
; || 01 4.2V
; || 10 2.7V
; || 11 2.5V (default)
; ||
; -------- Digital Supply Browout Level Select
; 00 4.5V
; 01 4.2V
; 10 2.7V
; 11 2.5V (default)
;
.org 0x807F
.db 0b10011111
; ||||||||
; |||||--- Data Flash Memory Size
; ||||| 000 Reserved
; ||||| 001 32k, 16k, 8k, or 4k Data Flash Memory
; ||||| 010 16k, 8k, or 4k Data Flash Memory
; ||||| 011 8k or 4k Data Flash Memory
; ||||| 100 4k Data Flash Memory
; ||||| 101 2k Data Flash Memory
; ||||| 110 1k Data Flash Memory
; ||||| 111 0 Data Flash Memory (default)
; |||||
; |||||--- Enable Watchdog Reset
; |||| 0 Disable
; |||| 1 Enable (default)
; ||||
; |||----- Enable Boot ROM
; ||| 0 Disable
; ||| 1 Enable (default)
; |||
; ||------ Reset Sector Lock - Alternate Flash Programming
; || 0 Enable Reset Sector Writing
; || 1 Enable Internal Boot ROM (default)
; ||
; |------- Program Memory Lock
; | 0 Enable Writing to Program Memory in UAM
; | 1 Disable writing to Program Memory in UAM (default)
; |
; |------- Enable Programming Memory Access (Security Bit)
; 0: After reset, Flash is accessible until mass erase
; 1: Fully accessible (default)
If different settings for the other
flags are required, they must be made in one file only, and then this single
file must be included on the linker’s command line in the makefile. Mistakenly
including two separate definitions for the same HCR register may cause run-time
(but not compile-time) errors.
Summary of Debug Commands
The following table summarizes the commands discussed so
far. These are all SDCC-SDB commands,
which are entered at the “(sdb).” prompt.
Items in brackets are replaced with valid text.
|
d
[name] |
Download
the “name” program to the target over the serial port |
|
r [name] |
Run
program on the target, using "name" map |
|
s [num]
|
Step
one or more lines |
|
n [num]
|
Next
one or more lines, over any function calls |
|
c |
Continue
execution |
|
p
[name] |
Print
“name” variable or register |
|
pl |
Print
current local variables |
|
pg |
Print
all global variables |
|
bp
[line or function] |
Set Breakpoint |
|
bc
[line or function] |
Clear
Breakpoint |
|
bl
[num] |
List
breakpoint(s) |
|
l [num] |
List
source code line |
|
l [num] [-num] |
List
range of source lines |
|
q |
Quit |
Executing Debugger Commands at Startup
When SDCC-SDB starts, a file named “.sdb” is checked for in the current directory (this is a four-character file name, with the first character being a period), and any SDCC-SDB commands that are found in it are automatically executed before the command prompt is presented. This is helpful for downloading a program automatically whenever SDCC-SDB is run, for instance. Automated test suites may also be prepared using this feature. Each MSC12xx program under development may have its own unique “.sdb” file.
Conclusion
The SDCC compiler and the SDCC-SDB debugger represent a
free, open-source option for developing software for the MSC12xx family of
microcontrollers. Development may take
place under any of the major computer operating systems. Also, all required software is conveniently
available for immediate download from the Internet. This makes a compelling choice for product
development using the Texas Instruments family of microcontrollers.